Step by Step: Power BI Q&A in Office 365

Simply, Q&A is a way to interact with your data, to filter, sort, aggregate, group and display data using natural language! Yea, you read that correctly, natural language! I was really blown away by this smart yet indeed useful feature.

Well, in this post I'll lay down how to utilize this amazing feature, step by step.
Prerequisites
- First of all, Power BI features associated with SharePoint are only available with Office 365 (cloud only, not available on-prem).
- In order to get Power BI capabilities (app) with Office 365, you need to register for Power BI for Office 365.
- You need to have Excel 2013 Professional Plus installed on your local machine.
- Finally, you need to start PowerPivot add-in Excel 2013.
Collect and Model Your Data
There are various astonishing ways to collect your data with Excel 2013, however, I will go with the easiest way in this post - which is manual data collection - nevertheless, I'll talk about these ways in other posts later.
In my Excel sheet I have collected data for the most visited websites as per Alexa ranking - you can fill whatever data you are comfortable with - here is a snapshot of the data I have in my Excel sheet:

After collecting your data you either:


In my Excel sheet I have collected data for the most visited websites as per Alexa ranking - you can fill whatever data you are comfortable with - here is a snapshot of the data I have in my Excel sheet:
After collecting your data you either:
- Use Power Query and then add your query to PowerPivot data model - which I'll address later in another blog post soon -.
- Or use PowerPivot directly (without using Power Query):
- Select your data that's on the worksheet.
- Locate and click PowerPivot tab on the top menu.
- Click on "Add to Data Model" which is under the PowerPivot tab.
- The PowerPivot for Excel window will pop out showing your selected data. You can model your data (Filter, merge, append, etc...) using the PowerPivot management.
- At this point we will do one thing, which is adding synonyms. This is the way the Q&A feature interacts with data and columns. Locate and click on the "Advanced" tab in the PowerPivot management window, and then click on synonyms.
- Well, the first synonym represents the data table name, change that into popularity index. As for the columns synonyms, add websites for the site column, add rank to Alexa rank column, add listing to domains listing column and add category to type column. Your synonyms should look like this:
- Close the PowerPivot management window, save your Excel sheet and close.
Upload and Enable Power BI Q&A
- Now, open your Office 365 site with Power BI app enabled.
- Go to Site Contents and upload your Excel document to "Documents" library.
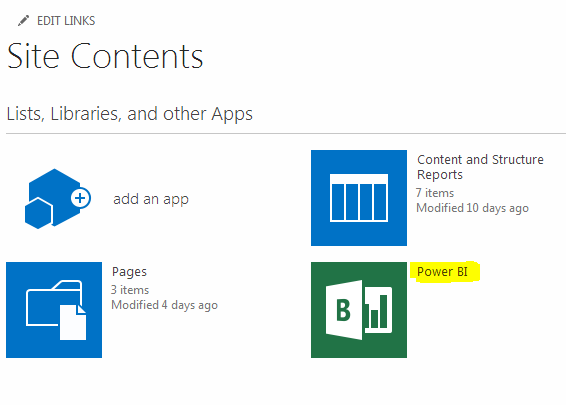
- After uploading your document, locate and click on Power BI app at the site contents page.
- In the Power BI app home page, you should find the excel document that you have uploaded earlier to "Documents" library.
- Click on the triple dot button and then click "Enable".
- A confirmation pop window will appear, click "Enable".
- You can close the pop up window after clicking "Enable", or you can wait until the Power BI capabilities are enabled, where you get a confirmation message.
- Click the close button, and yet again locate your excel document and click on the triple dot button, where you need to add your Excel document to Q&A.
Get Ready to be Blown Away by Q&A
- After adding your Excel document to Q&A, click on "Ask with Power BI Q&A" link, which is on the upper right of the Power BI app home page.
- Now, you can start asking questions and enjoy the awesomeness of Power BI Q&A !!!
- Start by asking "Show all popularity indices"
- The table seems to be out of order, try asking to sort your table by rank "show all popularity indices sorted by rank ascending as table".
- Show some graphs for domains listing, try "show all popularity indices sorted by listing descending"
- Show data as pie graph, "show all popularity indices sorted by listing descending as pie chart"
- There are countless questions that you can ask to model your data, additionally you can use the report control pane (on the right side of the report) to enhance your data modeling.

Enjoy !!!


Microsoft has actively sustained what they call “a blistering pace of innovation” and, whilst
ReplyDeletelistening to user needs, they continue to update Power BI with monthly updates.
Microsoft’s Power BI is new, but excitingly it’s evolving virtually on a monthly basis.
So just when you realize how brilliant the Power BI tool is, you suddenly discovered it’s just got even better!
Data Bear Data Bear is one of the many companies helping clients with this
powerful self-service business intelligence (BI) offering, and it didn’t take long for their team to identify Power BI as a serious game changer.
Specializing in business intelligence consulting, Data Bear founder,
Johann Joubert believes Power BI has become the single most powerful tool for businesses to use to ensure the full range of businesses are
ahead of the rapidly changing BI world and the opportunities it offers.
Nice blog. IntelliMindz is the best IT Training in Bangalore with placement, offering 200 and more software courses with 100% Placement Assistance.
DeletePower BI Online Training
Power BI Course In Bangalore
Power BI Training In Chennai
Its very informative blog and useful article thank you for sharing with us , keep posting learn
ReplyDeletemore about Microstrategy Training
Power BI Training